=
We’ve all been there. You’re in the middle of an important Zoom call, or perhaps you’re finally settling in to stream a new recipe, and suddenly—the spinning wheel of death. Your connection drops. You call your Internet Service Provider (ISP), wait on hold for twenty minutes, and finally get an agent who tells you, with total confidence, that “everything looks fine on our end.” They suggest you restart your router. They imply it’s your hardware. They might even suggest you upgrade to a more expensive plan.
Here’s the thing: they’re often wrong. But without data, you can’t prove it.
I call this the “support call from hell,” and for years, I just took it. I assumed maybe my router was getting old or my Austin apartment had “thick walls.” But as someone who obsesses over High Lifestyle ROI, I realized that my internet is a utility just like water or electricity. I wouldn’t accept a “maybe” from the power company if my lights were flickering.
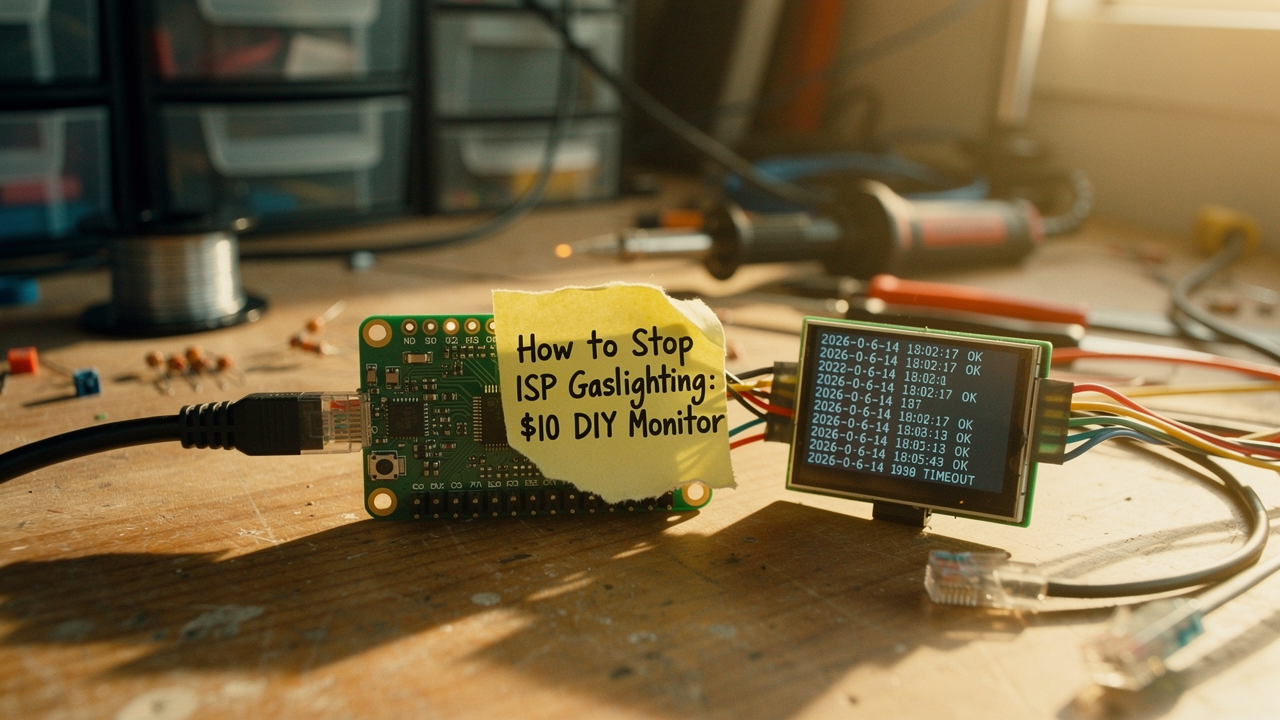
Setting up a DIY internet monitor is one of the best “set it and forget it” projects you can do. For about $10 and 30 minutes of setup, you can create a “Receipt Generator”—a dedicated device that logs every single outage, latency spike, and speed dip. When the ISP tries to shift the blame, you don’t argue; you just send them the logs.
The Anatomy of ISP Gaslighting: Why ‘Restart Your Router’ is a Trap
In psychology, gaslighting is a tactic where someone makes a target doubt their own perception of reality by denying verifiable facts [2]. In the world of tech support, this manifests as “blame shifting.” It’s a corporate strategy used to avoid responsibility for infrastructure failures by redirecting the problem back to the consumer [1].
When an ISP agent tells you “the signal looks green,” they are often looking at a snapshot of a single moment, not the intermittent packet loss that’s actually ruining your day. This creates a power imbalance. They have the “official” tools, and you have… your frustrated feelings. By building your own monitor, you’re creating an objective reality check.
It’s important to distinguish between legitimate troubleshooting and script-bound dismissal. If a technician asks you to check your cables, that’s fair. If they tell you that 5% packet loss is “normal for your area,” that’s gaslighting. Having a month’s worth of data allows you to move past the entry-level scripts and get escalated to the people who can actually fix the line.
The $10 Hardware: Reclaiming Power on a Budget
You don’t need a massive server rack to hold your ISP accountable. In fact, the most effective monitors are small, low-power devices that stay out of the way. According to network security experts, choosing a dedicated device that consumes only 2–5W ensures your monitoring doesn’t hike up your electric bill while it works in the background [5].
Option A: The ‘Parts Bin’ Build (Cost: $0)
Before you buy anything, look around. Do you have an old laptop with a broken screen? An always-on NAS (Network Attached Storage)? Even an old desktop gathering dust in the closet can work. If it can run Docker, it can be your monitor.
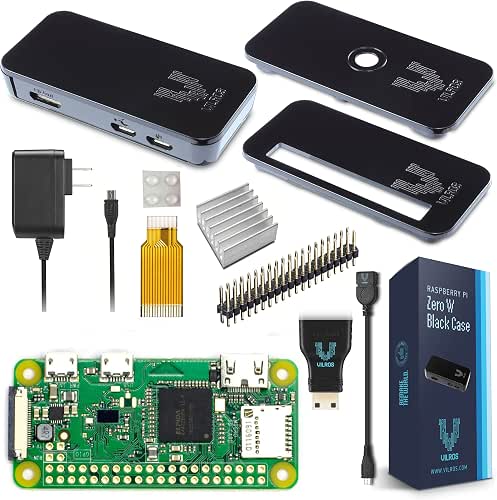
Option B: The Dedicated $10 SBC (Cost: ~$10-15)
If you want a dedicated “black box” that just sits next to your router, a Single Board Computer (SBC) is the way to go.
I’ll be honest: I ignored my intermittent connection drops for months because I didn’t want another “project” on my plate. I tried buying a more expensive “gaming” router, but the drops kept happening. What finally clicked for me was seeing a build by Jeff Geerling that used a tiny Raspberry Pi to log network health [4]. I realized I didn’t need a $300 router; I needed a $10 witness. I grabbed a basic SBC, plugged it directly into my gateway, and within 48 hours, I had the proof that my local node was oversaturated every day at 4:00 PM.
Micro-Verdict: The ultimate low-cost “witness” for your network health.

The ‘Receipt Generator’ Stack: Open-Source Tools That Don’t Lie
To turn your hardware into an accountability tool, you need a software “stack.” We’re looking for “SRE-grade” data—the same stuff Site Reliability Engineers use to keep massive websites running.
Step 1: Installing Net Probe or Speedtest Tracker
The easiest way to start is with a Docker container. Tools like Speedtest Tracker or Net Probe are designed specifically for home users. They don’t just check your speed once; they run a test every 30 to 60 minutes and log the results in a database. For bandwidth measurements, it’s best to use the official Speedtest CLI by Ookla, as it’s the industry benchmark that ISPs are most likely to respect during a dispute [7].
Step 2: Visualizing the Truth with Grafana
Raw logs are hard to read, but graphs are hard to argue with. Grafana is an open-source visualization tool that takes your logs and turns them into beautiful, readable dashboards [6]. You can see exactly when your latency spikes or when your “100Mbps” connection drops to 5Mbps during peak hours.
- Essential: A Raspberry Pi or old PC running Linux
- Essential: Docker and Docker Compose installed
- Essential: Speedtest-Tracker container for automated speed logs
- Pro Upgrade: Prometheus Blackbox Exporter for millisecond-accurate uptime tracking
Understanding the Metrics: How to Read Your New Data
Once your monitor is running, you’ll start seeing a lot of numbers. To win an argument with an ISP, you need to know which ones are the “smoking guns.”
- Jitter: This measures the variation in time between data packets. If your jitter is consistently above 30ms, your video calls will lag and your gaming will feel “choppy,” even if your download speed looks high.
- Packet Loss: This is the big one. If your packet loss is over 1–2%, your connection is fundamentally unreliable. This is almost always an ISP-side issue (bad cables, failing connectors, or node congestion).
- 95th-Percentile Latency: Instead of looking at “average” latency, look at the 95th percentile. This tells you what your “worst-case” lag looks like for 5% of the time. If this number is huge, your internet will feel “stuttery.”
The Escalation Playbook: Using Data to Get Results
Now that you have the data, how do you use it? You don’t just call and complain; you present an “evidence package.”
When you get through to support, ask to be escalated to “Tier 2” or “Level 2” support immediately. Use this script: “I have 14 days of automated logs from a wired monitor showing consistent 4% packet loss and latency spikes over 200ms every afternoon between 4 PM and 7 PM. I’ve already ruled out my internal hardware.”
This language tells the agent you aren’t a casual user they can brush off with a “restart your router” script. This is the same methodology the FCC uses in its Rural Broadband Accountability Plan to ensure providers are actually doing their jobs [3].
When to Rule Out Your Wi-Fi
To make your data irrefutable, you must run your monitor via a wired Ethernet cable. If you try to complain about speeds while your monitor is on Wi-Fi, the ISP will (rightfully) blame “interference” or “distance from the router.” A wired connection proves the problem is coming from the wall, not the air.
Which Monitoring Persona Are You?
The Minimalist Remote Worker
You just need to know why your Slack keeps disconnecting during meetings.
- Essential: A simple Docker container running Speedtest-Tracker on your laptop.
- Essential: Scheduled tests every 1 hour.
- Pro Upgrade: Email alerts that notify you the moment the internet goes down.
The Power User / Gamer
You need millisecond precision to prove why you’re lagging in competitive matches.
- Essential: Dedicated Raspberry Pi wired to the router.
- Essential: Prometheus Blackbox Exporter for constant ICMP (ping) tracking.
- Essential: Grafana dashboard showing 24-hour jitter trends.
Living a “good life” means having an environment that supports you rather than frustrates you. In our digital age, reliable internet is the foundation of that environment. For the price of two lattes, you can stop guessing, stop arguing, and start holding your ISP to the standard you’re paying for.
Download my ISP Dispute Template below, and the next time your connection drops, you’ll be ready. Let me know in the comments—what’s the wildest excuse an ISP has ever given you for a slow connection?
Technical Disclaimer: Proceed with caution when using command-line tools and modifying network settings. Always ensure your hardware is properly cooled and secured.
References
- PMC6405044, 2019, The effect of admitting fault versus shifting blame on expectations for others to do the same, PubMed Central, https://pmc.ncbi.nlm.nih.gov/articles/PMC6405044/
- The Hague Psychologist, 2023, What is Gaslighting? Escaping Responsibility, https://www.thehaguepsychologist.nl/what-is-blame-shifting-escaping-responsibility
- USAC, 2024, FCC Rural Broadband Accountability Plan, https://www.usac.org/high-cost/resources/fcc-rural-broadband-accountability-plan
- Geerling, J., 2021, Monitor your Internet with a Raspberry Pi, Jeff Geerling Blog, https://www.jeffgeerling.com/blog/2021/monitor-your-internet-raspberry-pi
- LMG Security, 2022, How to Get Started with DIY Home Network Monitoring, https://www.lmgsecurity.com/home-network-monitoring
- Grafana Labs, 2024, Grafana Documentation, https://grafana.com/docs/
- Ookla, 2024, Speedtest CLI Official Documentation, https://www.speedtest.net/apps/cli
“`